


Lloyds Engineering Works Ltd (NSE: LLOYDSENGG / BSE: 539992) covering company summary, recent price & chart trends, quarterly performance, profit & loss highlights, shareholding/investors, and an analyst-style view (strengths, risks, valuation takeaways). I cite official filings and major market-data providers so you can verify any number quickly.
1) Quick summary — what the company doesLloyds Engineering Works Ltd is an engineering & manufacturing company engaged in design, fabrication, supply, erection and commissioning of mechanical, hydraulic, structural and process plant equipment (metallurgical/chemical/process plant equipment and related services). It is listed on both NSE and BSE (ISIN: INE093R01011). The company publishes results and annual reports on its corporate website.
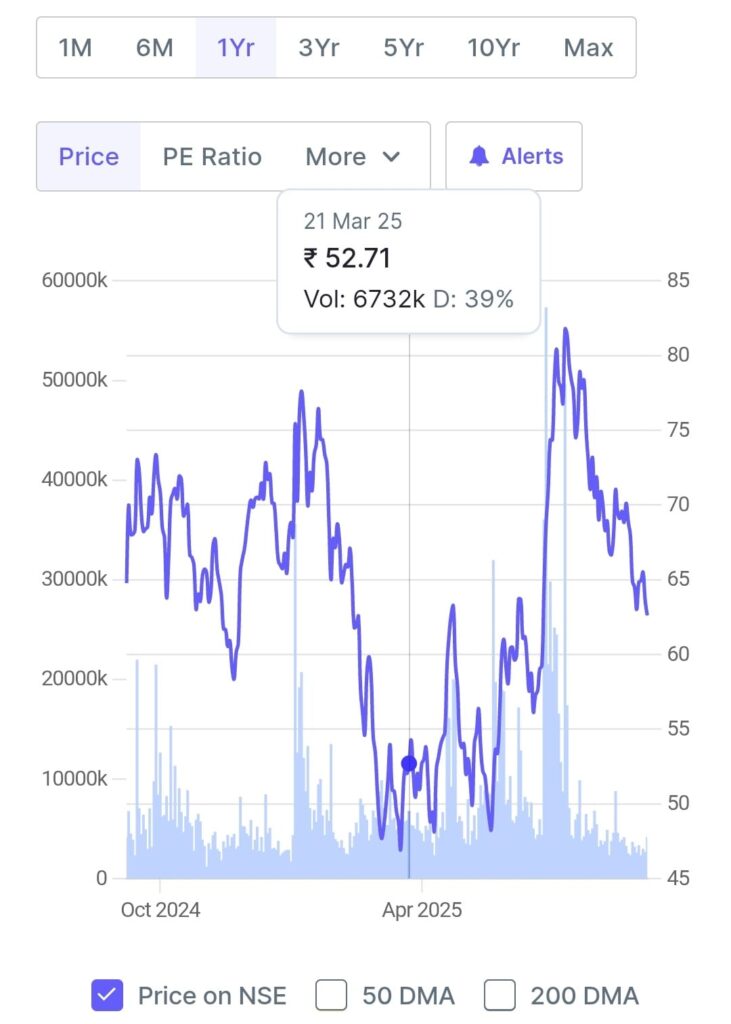
2) Market snapshot & recent price actionLatest quoted price (example close): ~₹62.6 per share (early September 2025 snapshot). 52-week range: roughly ₹42.7 (low) — ₹84.3 (high). Short-term performance: the stock gained in the prior 6 months (~+29% over 6 months) but is down ~6% over 1 year (figures published by brokers). (These market numbers move daily — citations above are live market pages.)—3) Recent quarterly trend (selected quarters)Publicly reported quarterly revenue (Net Sales / Income from operations) across recent quarters (consolidated / standalone disclosures are available on company site and Moneycontrol). Example quarter-level topline (₹ crore):Jun 2025: Net Sales ≈ 174.45 cr.Mar 2025: Net Sales ≈ 178.49 cr.Dec 2024: Net Sales ≈ 229.72 cr.Sep 2024: Net Sales ≈ 212.15 cr.(These are from the company’s quarterly disclosure summary as aggregated by financial-data sites.)
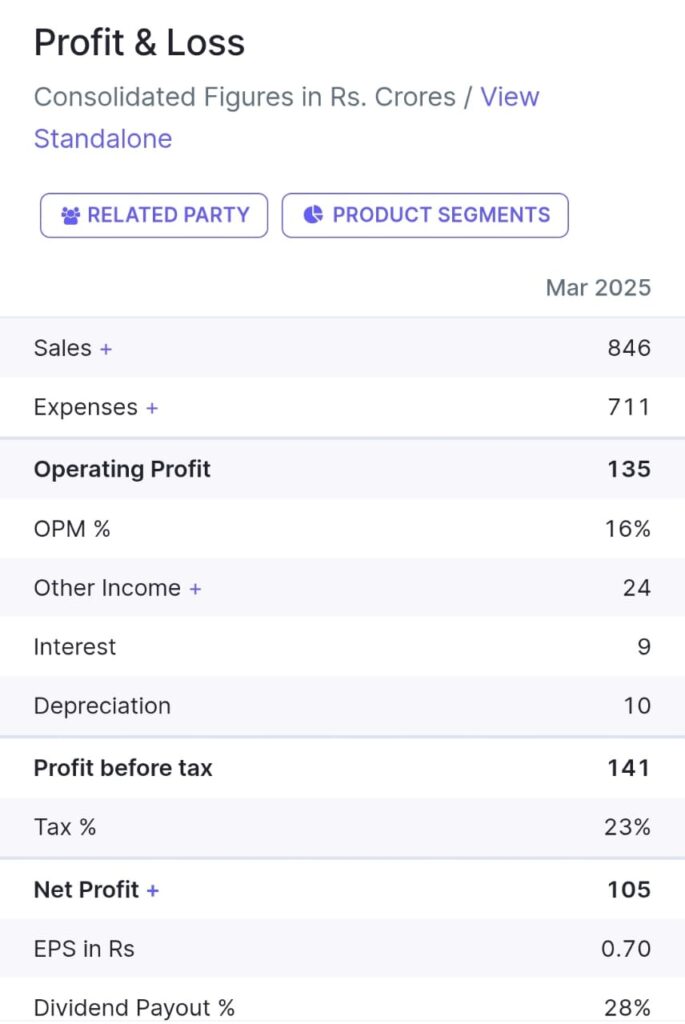
Takeaway: revenue has been lumpy quarter-to-quarter (typical for project-based engineering firms — timing of order execution and project milestones causes swings). Refer to company filings for line-by-line quarterly P&L. —4) Profit & Loss / Annual financial snapshot (latest audited FY shown)From consolidated/standalone financials for FY ending Mar 2025 (rounded, ₹ crore):Total Income (FY2024-25): ~₹870 cr (sales ~₹846 cr + other income).Total expenses: ~₹710–711 cr.Operating profit: ~₹135 cr (OP margin ~16%).Profit before tax (PBT): ~₹141 cr.Profit after tax (PAT): ~₹108 cr (approx). For full line-by-line figures (gross margin, raw material cost, interest, depreciation, tax) see the company’s audited annual financial statements and the consolidated profit & loss in the annual report / results page
5) Balance sheet & cash flow highlights (high level)
Shareholders’ funds have expanded materially over recent years (equity base increased due to capital raises / reserves). For example total shareholders’ funds rose from ~₹195 cr (Mar 2023) to ~₹645 cr (Mar 2025) per summarized balance-sheet extracts.
Interest expenses reported are modest vs operating profit, indicating leverage is not the dominant issue in the latest reported year. (See annual financials for maturity profile and detailed borrowings.)
6) Promoters / major investors / shareholding pattern
Promoter holding: has moved markedly — promoters held ~49.36% as of June 2025 (down from ~56% earlier in the year), indicating promoter stake reduction during recent quarters.
Institutional holdings: Mutual funds and FIIs hold only a very small portion (MFs ~0.14–0.15%; FIIs low single-digit %), so the share register is predominantly promoter + retail/public.
There have been pledge / unpledge and changes in promoter pledging reported in recent quarters — check the company’s shareholding disclosures for exact pledged percentages and corporate-action notes.
Investor takeaway: promoter selling / stake dilution is a key structural development investors should monitor (it can affect sentiment and liquidity).
7) Valuation & key ratios (what markets are charging)
Different data providers report a high P/E relative to long-term averages (examples: reported trailing/TTM P/E figures are elevated — sources show P/E figures in multiples that have historically been volatile). Price-to-book and P/E metrics appear above typical industry medians, reflecting market optimism/expectation or low free float. Example metrics from public screens: high P/B and elevated P/E (see Screener/Trendlyne/Wisesheets pages for live ratios).
8) Recent corporate actions / notable events
The company has reported dividends in recent years (small per-share payouts) and corporate actions like rights issues or capital raises have been disclosed previously — check the Announcements / Results section on the corporate site for specifics (e.g., rights issue, dividend dates).
9) Analyst-style evaluation — strengths, risks, and what to watch
Strengths-
Project execution business with diversified engineering services — revenue can scale quickly when large orders execute.
Improving profitability in the latest full year (healthy operating margin ~16% in FY25).
Lower financial leverage (interest costs modest vs operating profit) in recent reported year.
Risks-
Volatile quarterly revenue: project timing leads to swings in revenue and margins — this increases short-term earnings unpredictability.
Promoter stake dilution / selling observed in recent quarters — can be a negative sentiment driver.
High market valuation (elevated P/E & P/B) makes the stock sensitive to any earnings disappointment.
Concentration / execution risk: for engineering firms, single large projects, client concentration or delays can cause sharp P&L impacts — read contract disclosures in annual report.
What to watch next (practical checklist for investors)
1. Quarterly order book / order wins — new large contracts are the main growth trigger. (Company announcements/press releases.)
2. Promoter holding / pledge updates — monitor SEBI / exchange shareholding disclosures.
3. Guidance / margins from analyst calls or management comments in the annual report.
4. Cash flow & working capital — project companies can see big swings in working-capital needs; check cash flow statements in the annual report.
Bottom line / investment takeaway
Lloyds Engineering is a mid-cap engineering company that shows real operating profits and clear revenue scale in the last reported fiscal year. However, the combination of lumpy quarterly revenues, promoter stake changes, and relatively high valuation multiples increases risk for investors who are not comfortable with execution / sentiment risk. If you’re evaluating the stock, focus first on (a) order book growth & contract wins, (b) promoter shareholding disclosures and pledge status, and (c) next two quarterly results for revenue/margin stability before sizing a position.
=> Sources (selected)
Company — Results / Financials / Annual Reports (official): Lloyds Engineering website.
Quarterly & financial aggregates: Moneycontrol (quarterly results, balance sheet).
Market data & live price / 52-week range: Trendlyne, ICICI Direct, Business Standard, Tickertape.
Fundamental screens, promoter holding & ratios: Screener.in, Trendlyne, AngelOne, Wisesheets.
 admlnlx